云项目可观测性
🌐 Cloud project observability
Page summary:可观测性标签直接从你的项目仪表板展示使用指标、端点流量和基础设施健康数据。使用它来监控 API 和带宽消耗,识别高流量端点,并跟踪 CPU 和内存使用情况随时间的变化。
🌐 The Observability tab surfaces usage metrics, endpoint traffic, and infrastructure health data directly from your project dashboard. Use it to monitor API and bandwidth consumption, identify high-traffic endpoints, and track CPU and Memory usage over time.
可观察性 标签可以从你的项目仪表板访问。它包含 4 个部分:摘要、项目消耗、流量洞察 和 CPU 和内存使用情况。
🌐 The Observability tab is accessible from your project dashboard. It contains 4 sections: Summary, Project consumption, Traffic insights, and CPU and Memory usage.
摘要
🌐 Summary
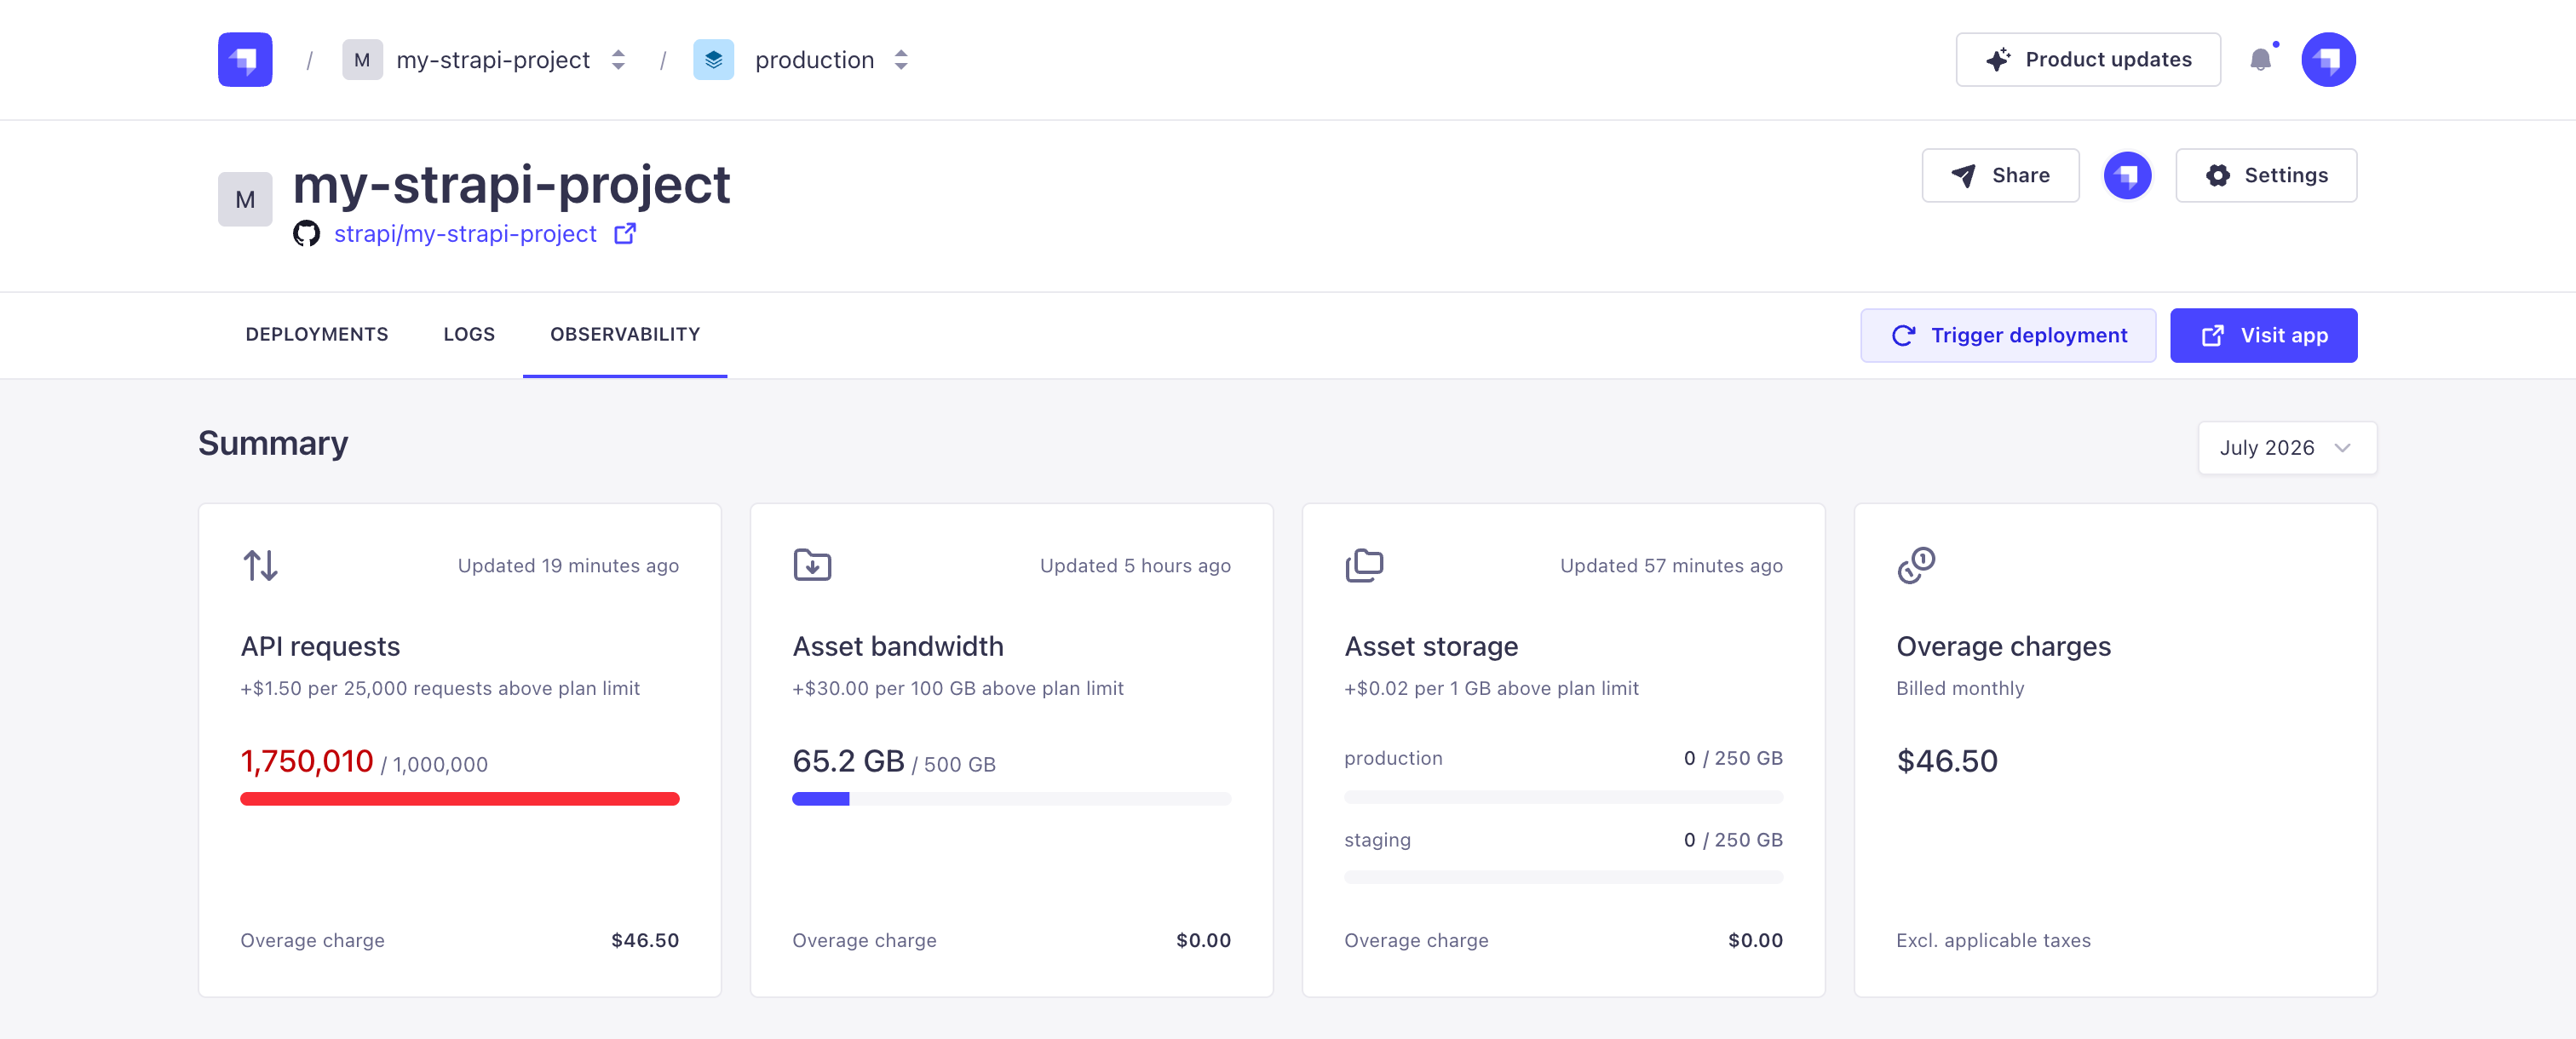
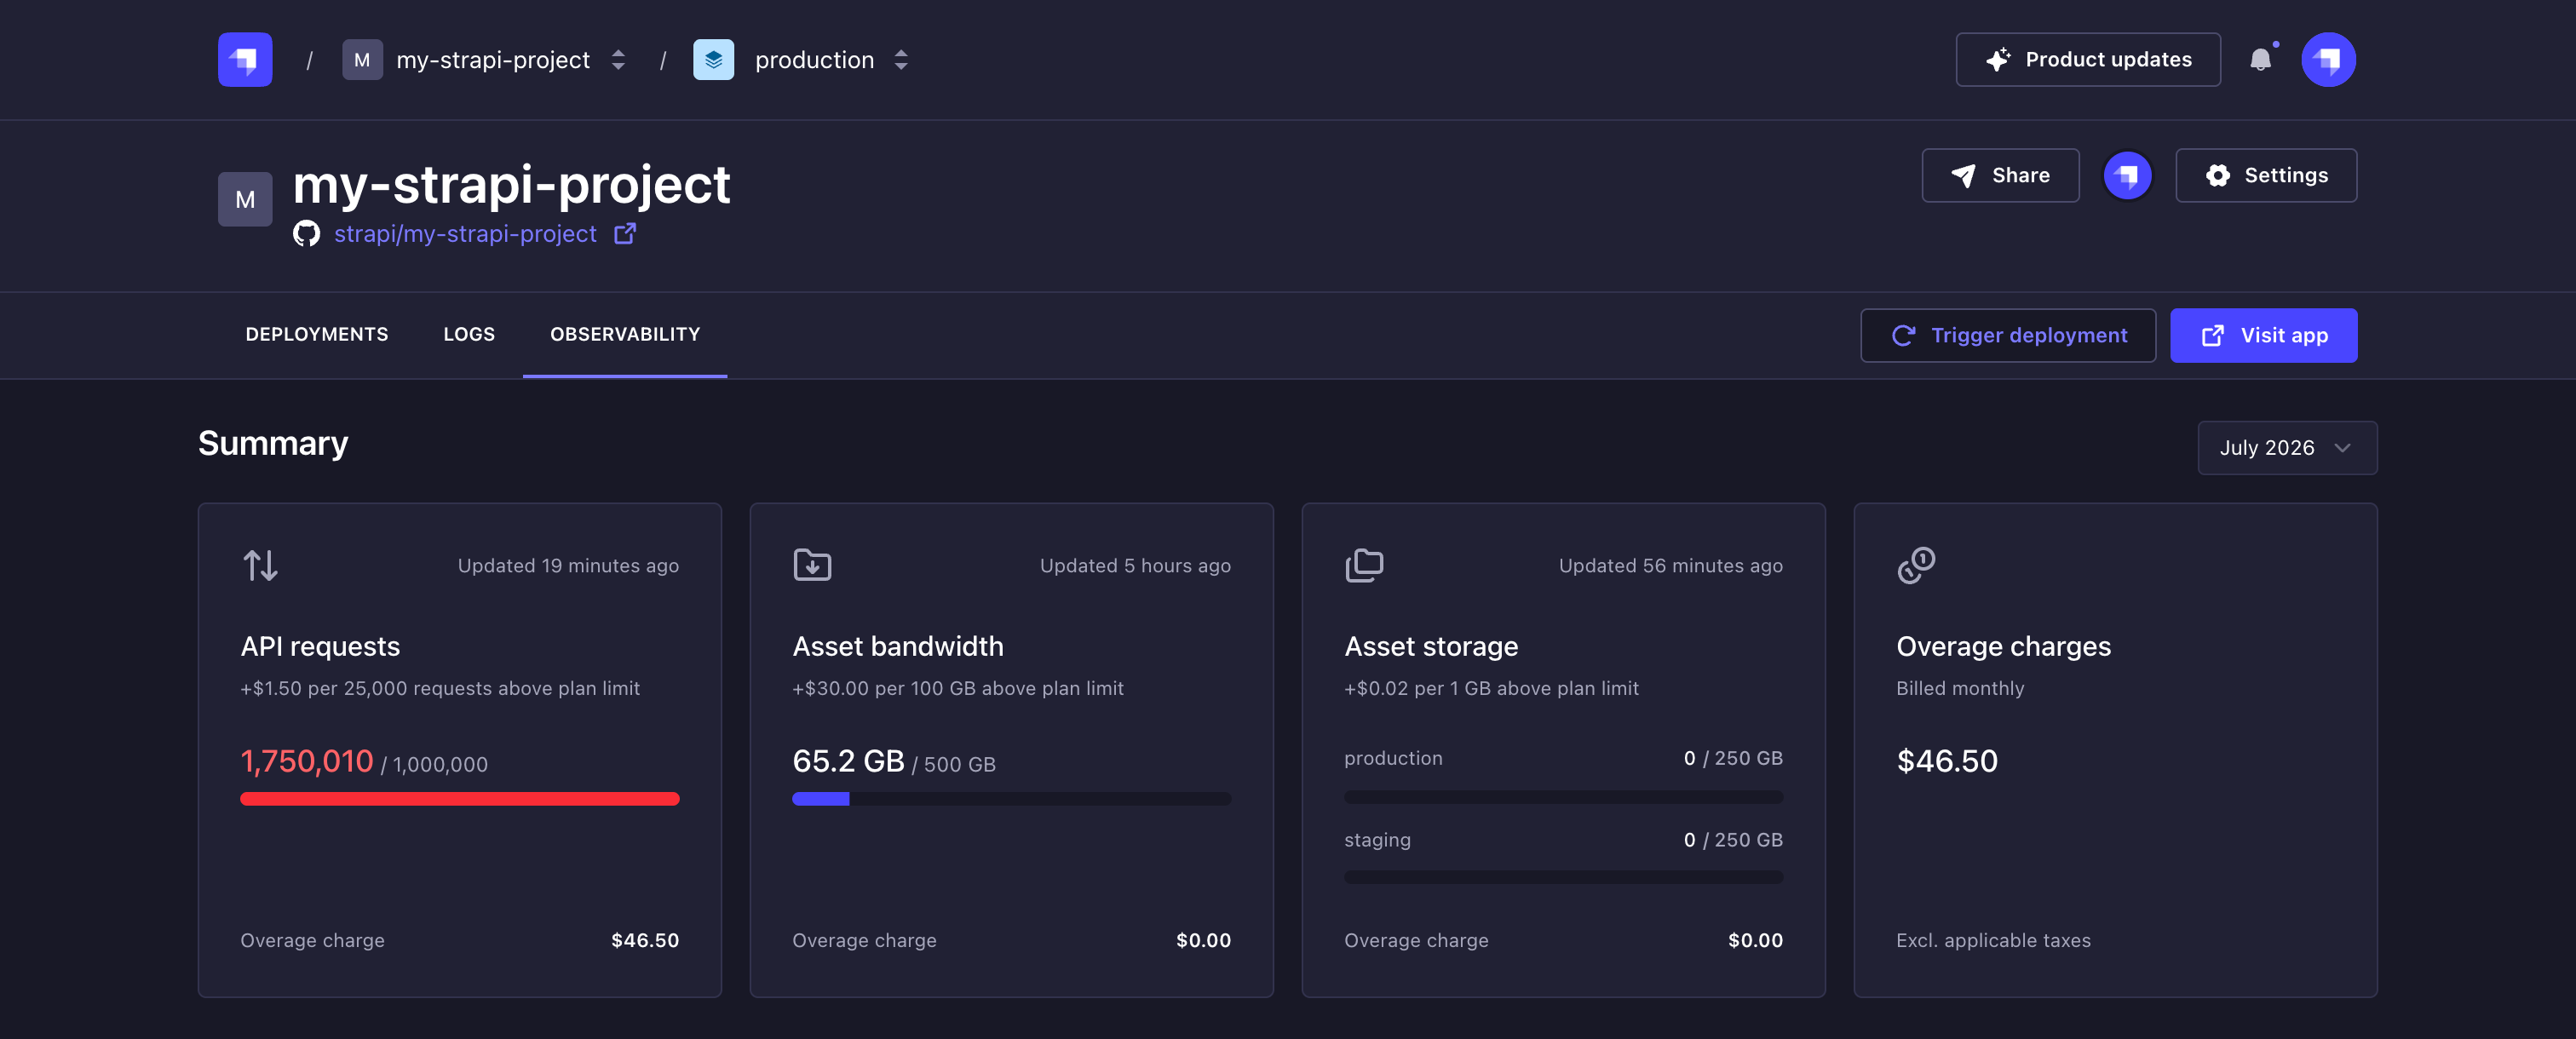
摘要 部分显示你每月的资源使用概览以及任何超额费用。
🌐 The Summary section displays a monthly overview of your resource consumption and any overage charges.
使用本节右上角的月份选择器查看前几个月。
🌐 Use the month picker in the top-right corner of the section to view previous months.
该部分包含4张指标卡:
🌐 The section contains 4 metric cards:
| 卡片 | 描述 |
|---|---|
| API 请求 | 本月的 API 请求总数,相对于你的计划限额显示带进度条。如果超过限额,则显示超额费用。 |
| 资源带宽 | 本月消耗的总带宽,相对于你的计划限额显示带进度条。如果超过限额,则显示超额费用。 |
| 资源存储 | 每个环境使用的存储。每个环境显示进度条,显示其使用量相对于限额的情况。如果在任何时间段内任何环境超出限额,则显示超额费用。 |
| 超额费用 | 本月的总超额金额,不含适用税费。 |
API 请求的数据是实时可用的,而资源带宽和资源存储是每小时更新一次的。要更新这些指标,请刷新仪表板。
🌐 API requests data is available in real time, whereas Asset bandwidth and Asset storage are updated hourly. To update these metrics, refresh the dashboard.
有关使用计费和超量管理的更多信息,请参见 使用与计费。
🌐 For more information on usage billing and overage management, see Usage & Billing.
项目消耗
🌐 Project consumption
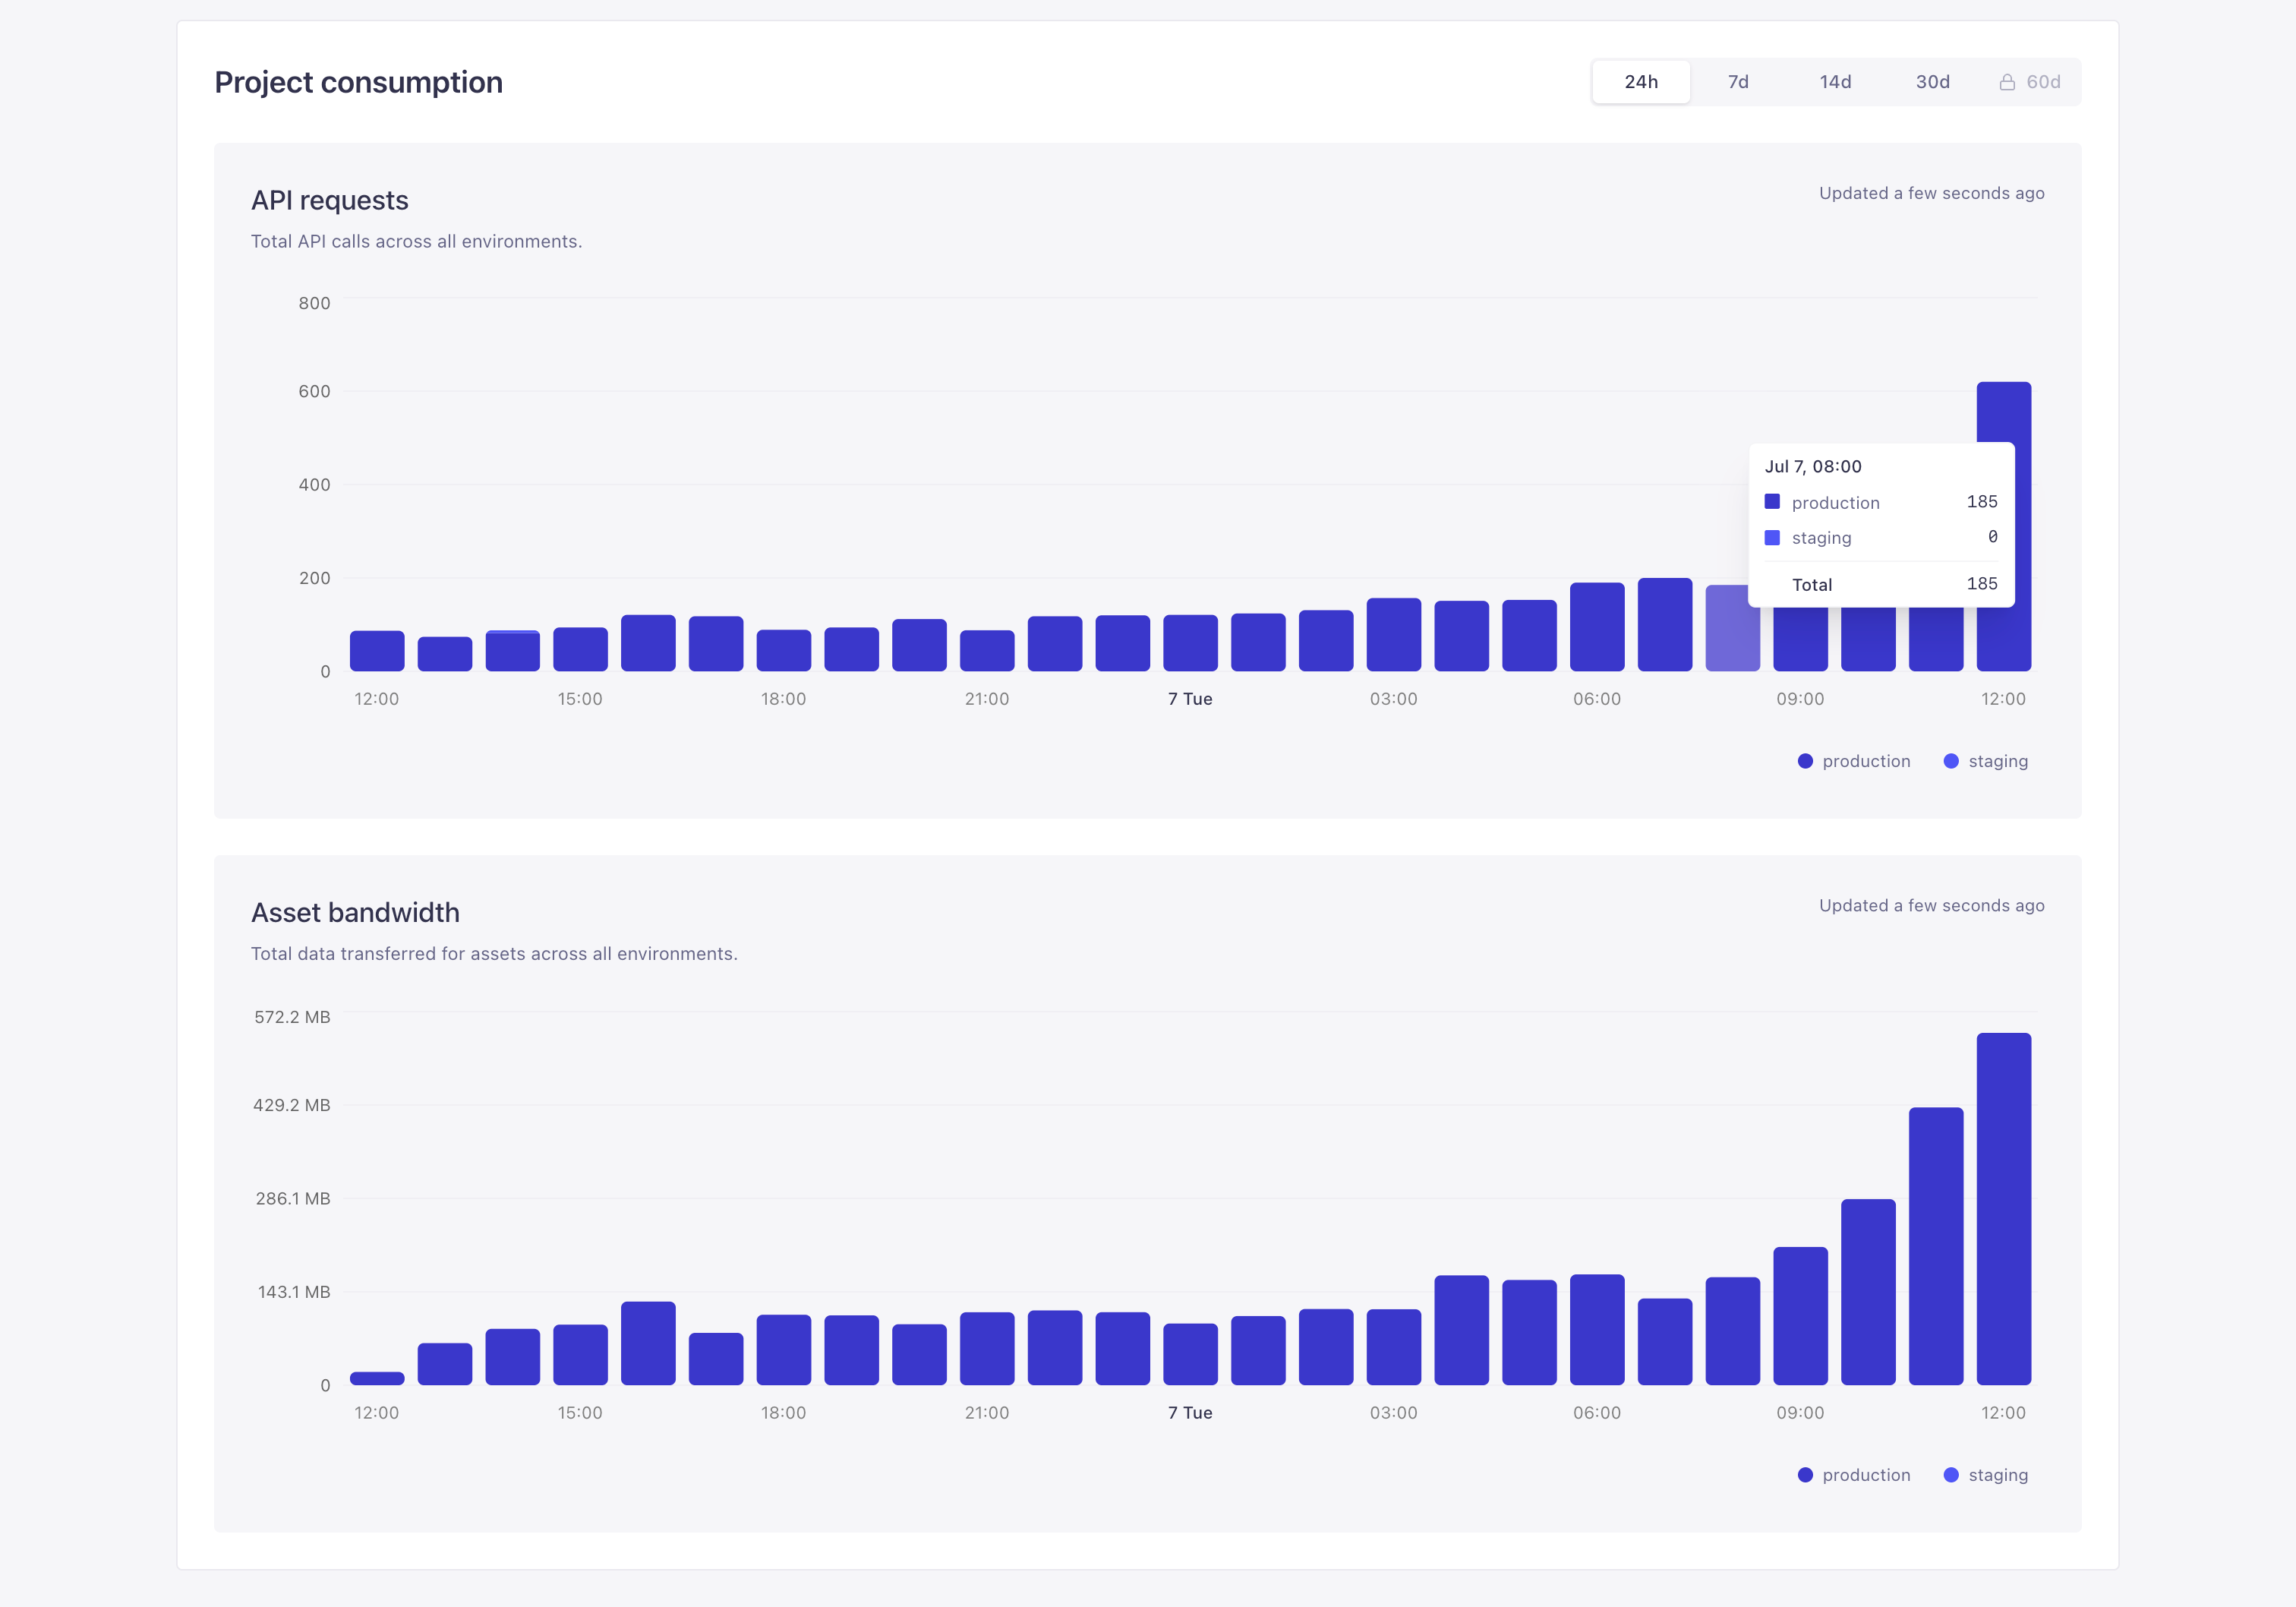
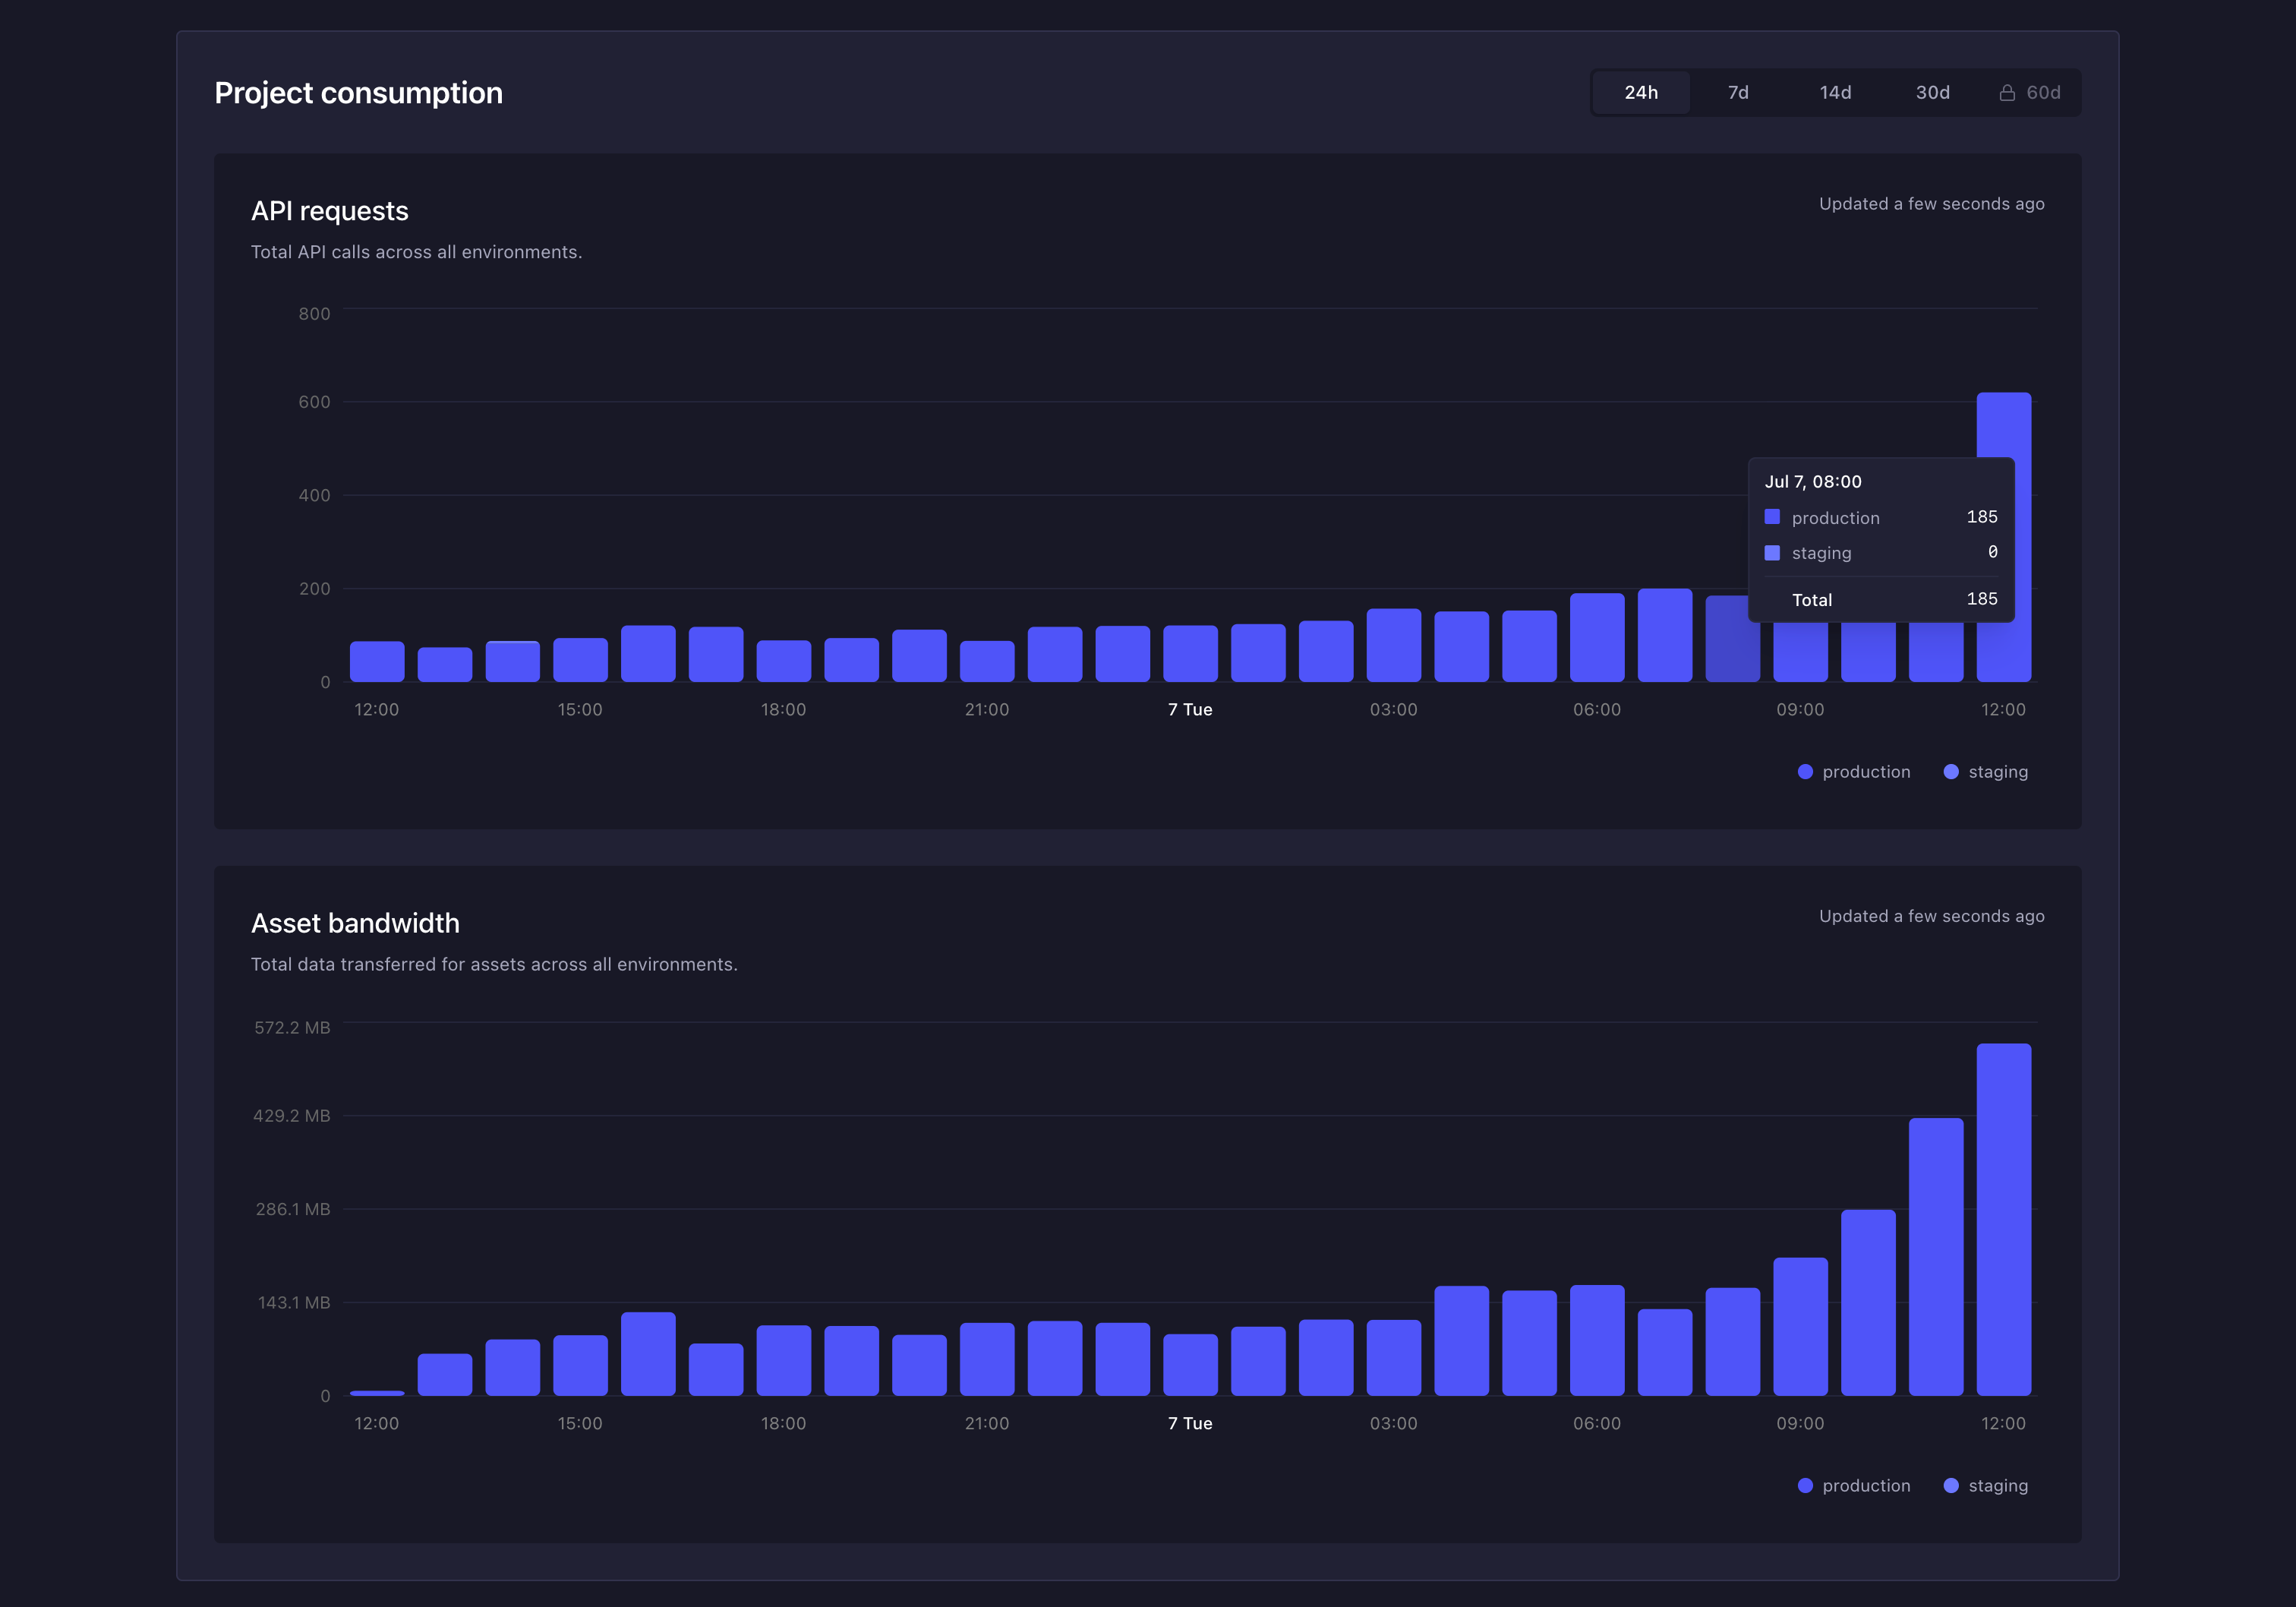
项目消耗部分显示按时间划分的 API 请求和资源带宽使用情况,并按环境分列。
🌐 The Project consumption section shows API requests and asset bandwidth usage over time, broken down by environment.
使用右上角的时间范围选择器来调整显示的时间段:
🌐 Use the time range selector in the top-right corner to adjust the period displayed:
本节包含2张图表:
🌐 The section contains 2 charts:
- API 请求:所有环境的总 API 调用次数,以堆叠柱状图显示。
- 资源带宽:在所有环境中传输的资源总数据,使用相同的堆叠条形图格式。
每个柱状图代表一个时间段(按所选范围,可为每小时或每天),并按环境堆叠。在图表上悬停可查看工具提示,显示特定时间点各环境的消耗明细。要从图表中过滤环境,请点击图例中的环境名称。
🌐 Each bar represents a time bucket (hourly or daily, depending on the selected range) and is stacked by environment. Hover over the chart to see a tooltip showing the consumption breakdown per environment at a specific point in time. To filter out environments from the graph, click on their name in the legend.
流量洞察
🌐 Traffic insights
流量洞察 部分显示所选环境和时间范围内哪些 API 端点和资源产生的流量最多。
🌐 The Traffic insights section shows which API endpoints and assets generate the most traffic for the selected environment and time range.
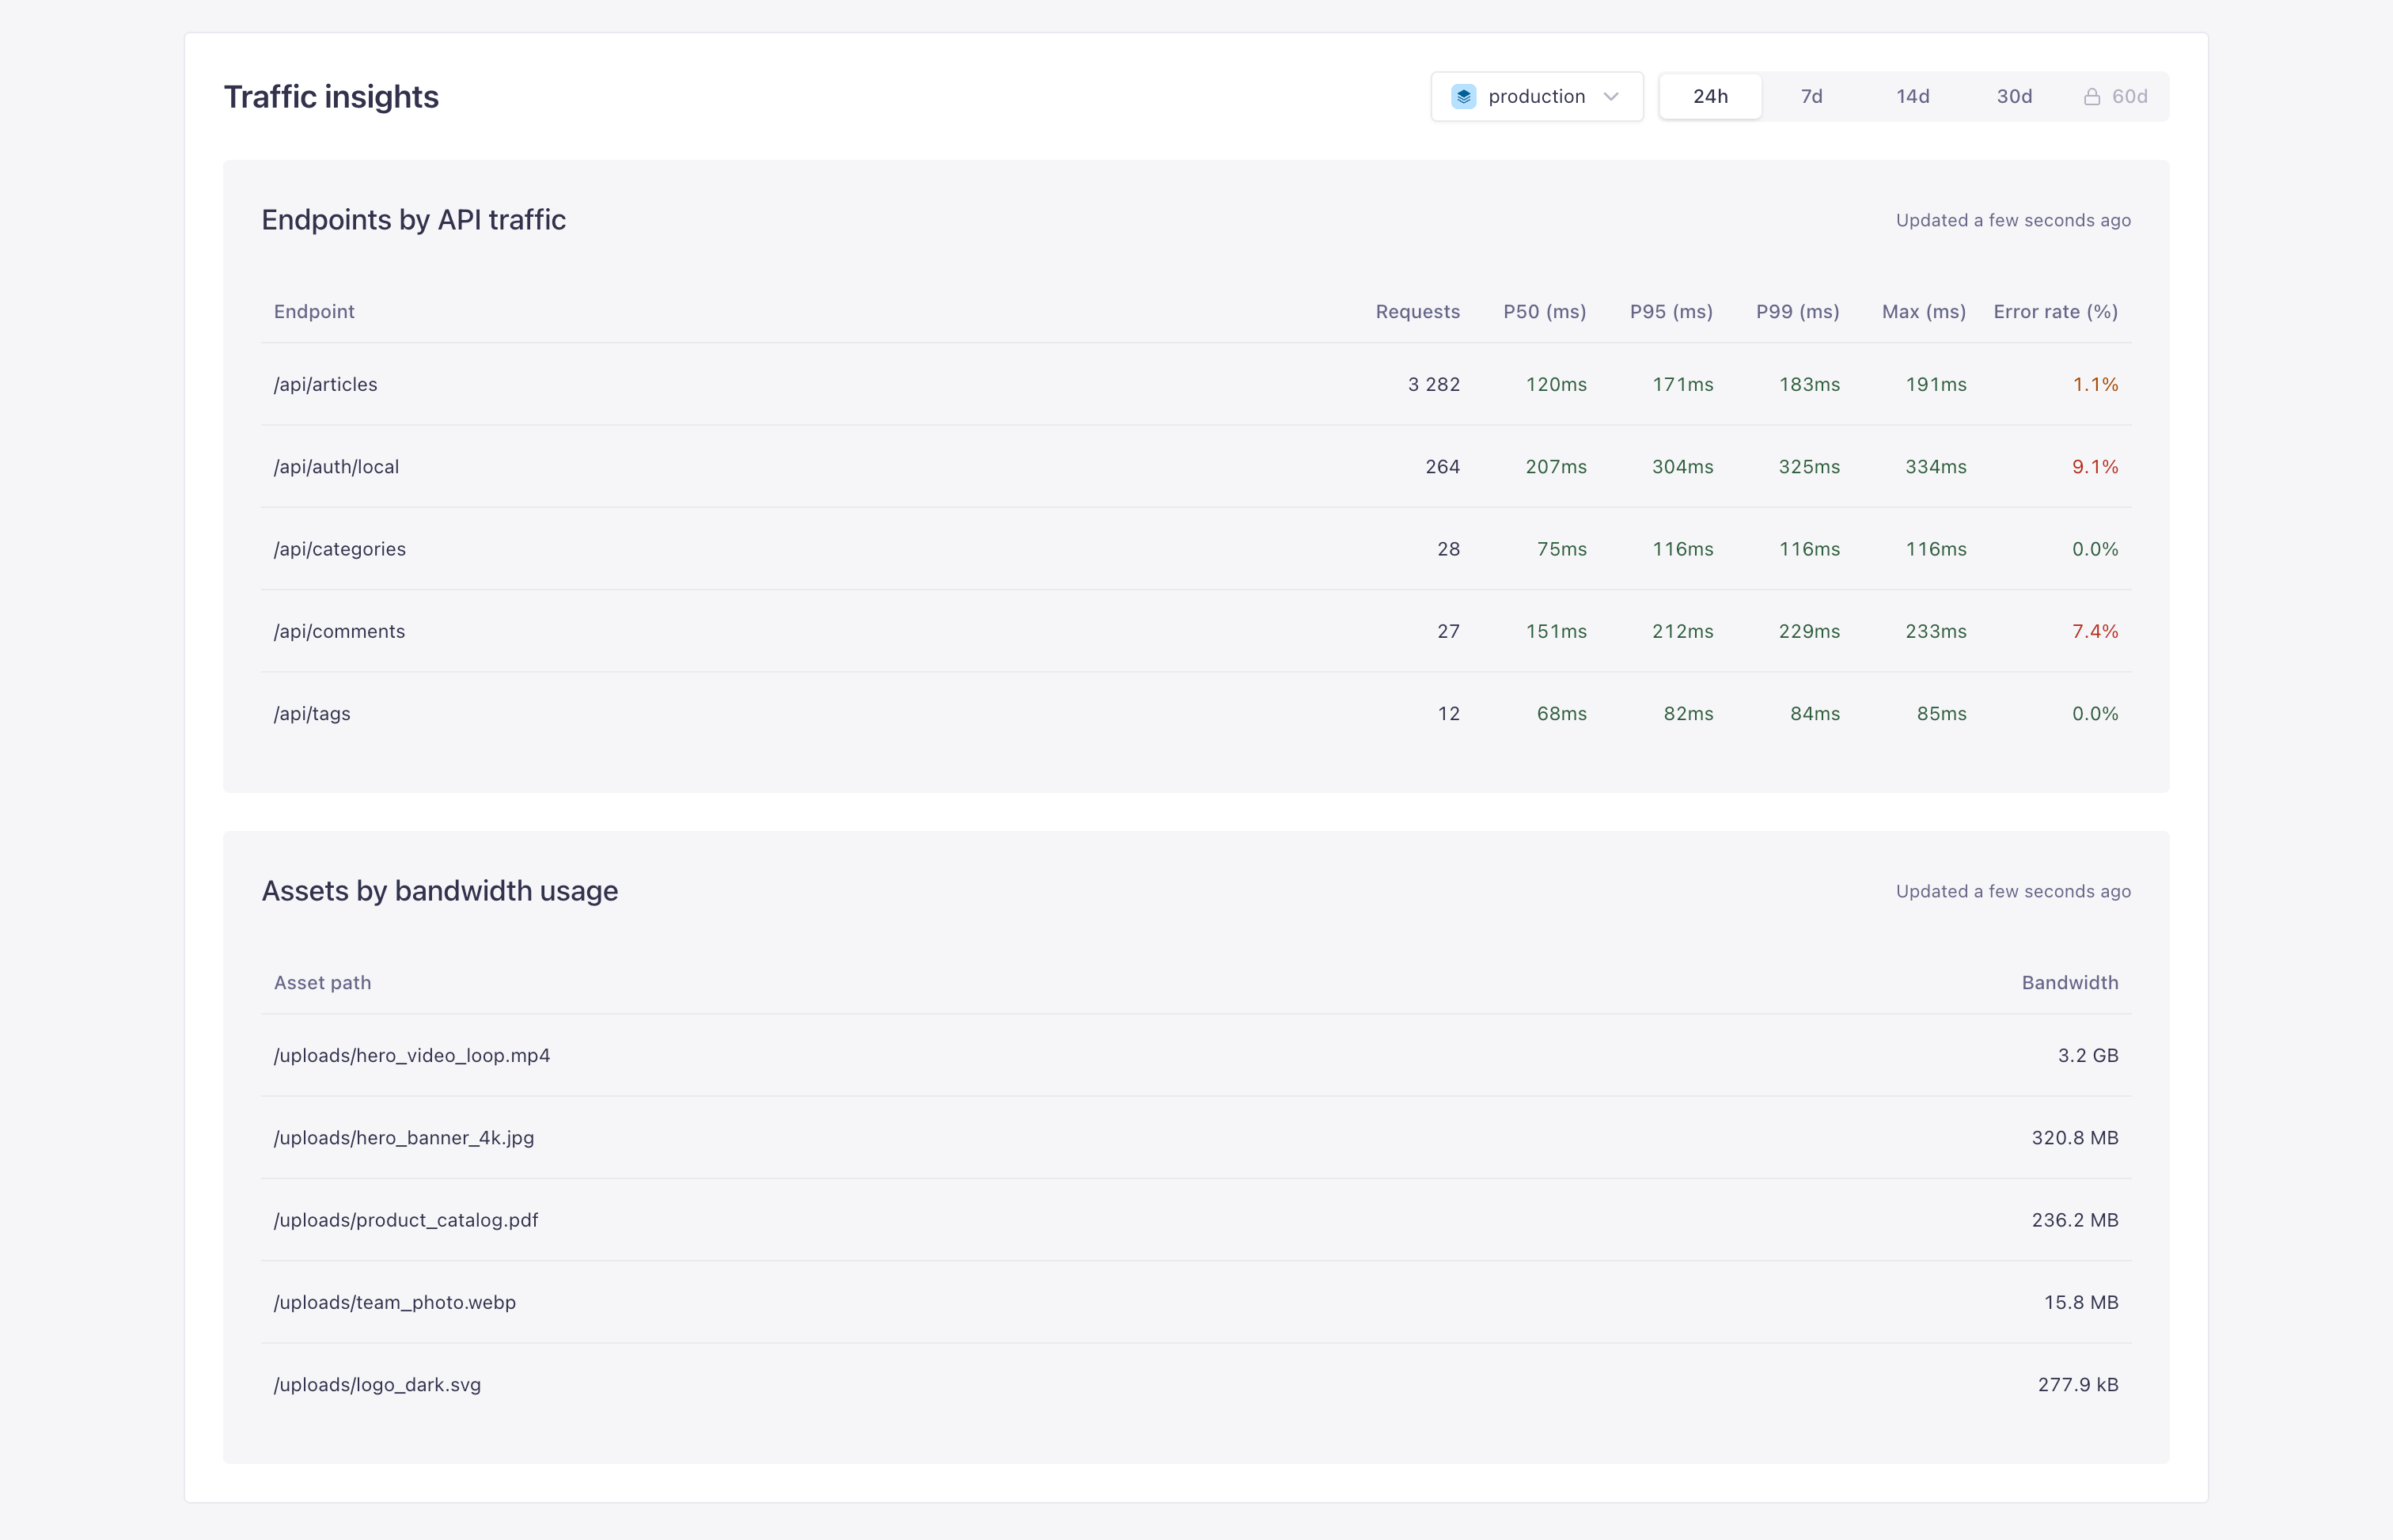
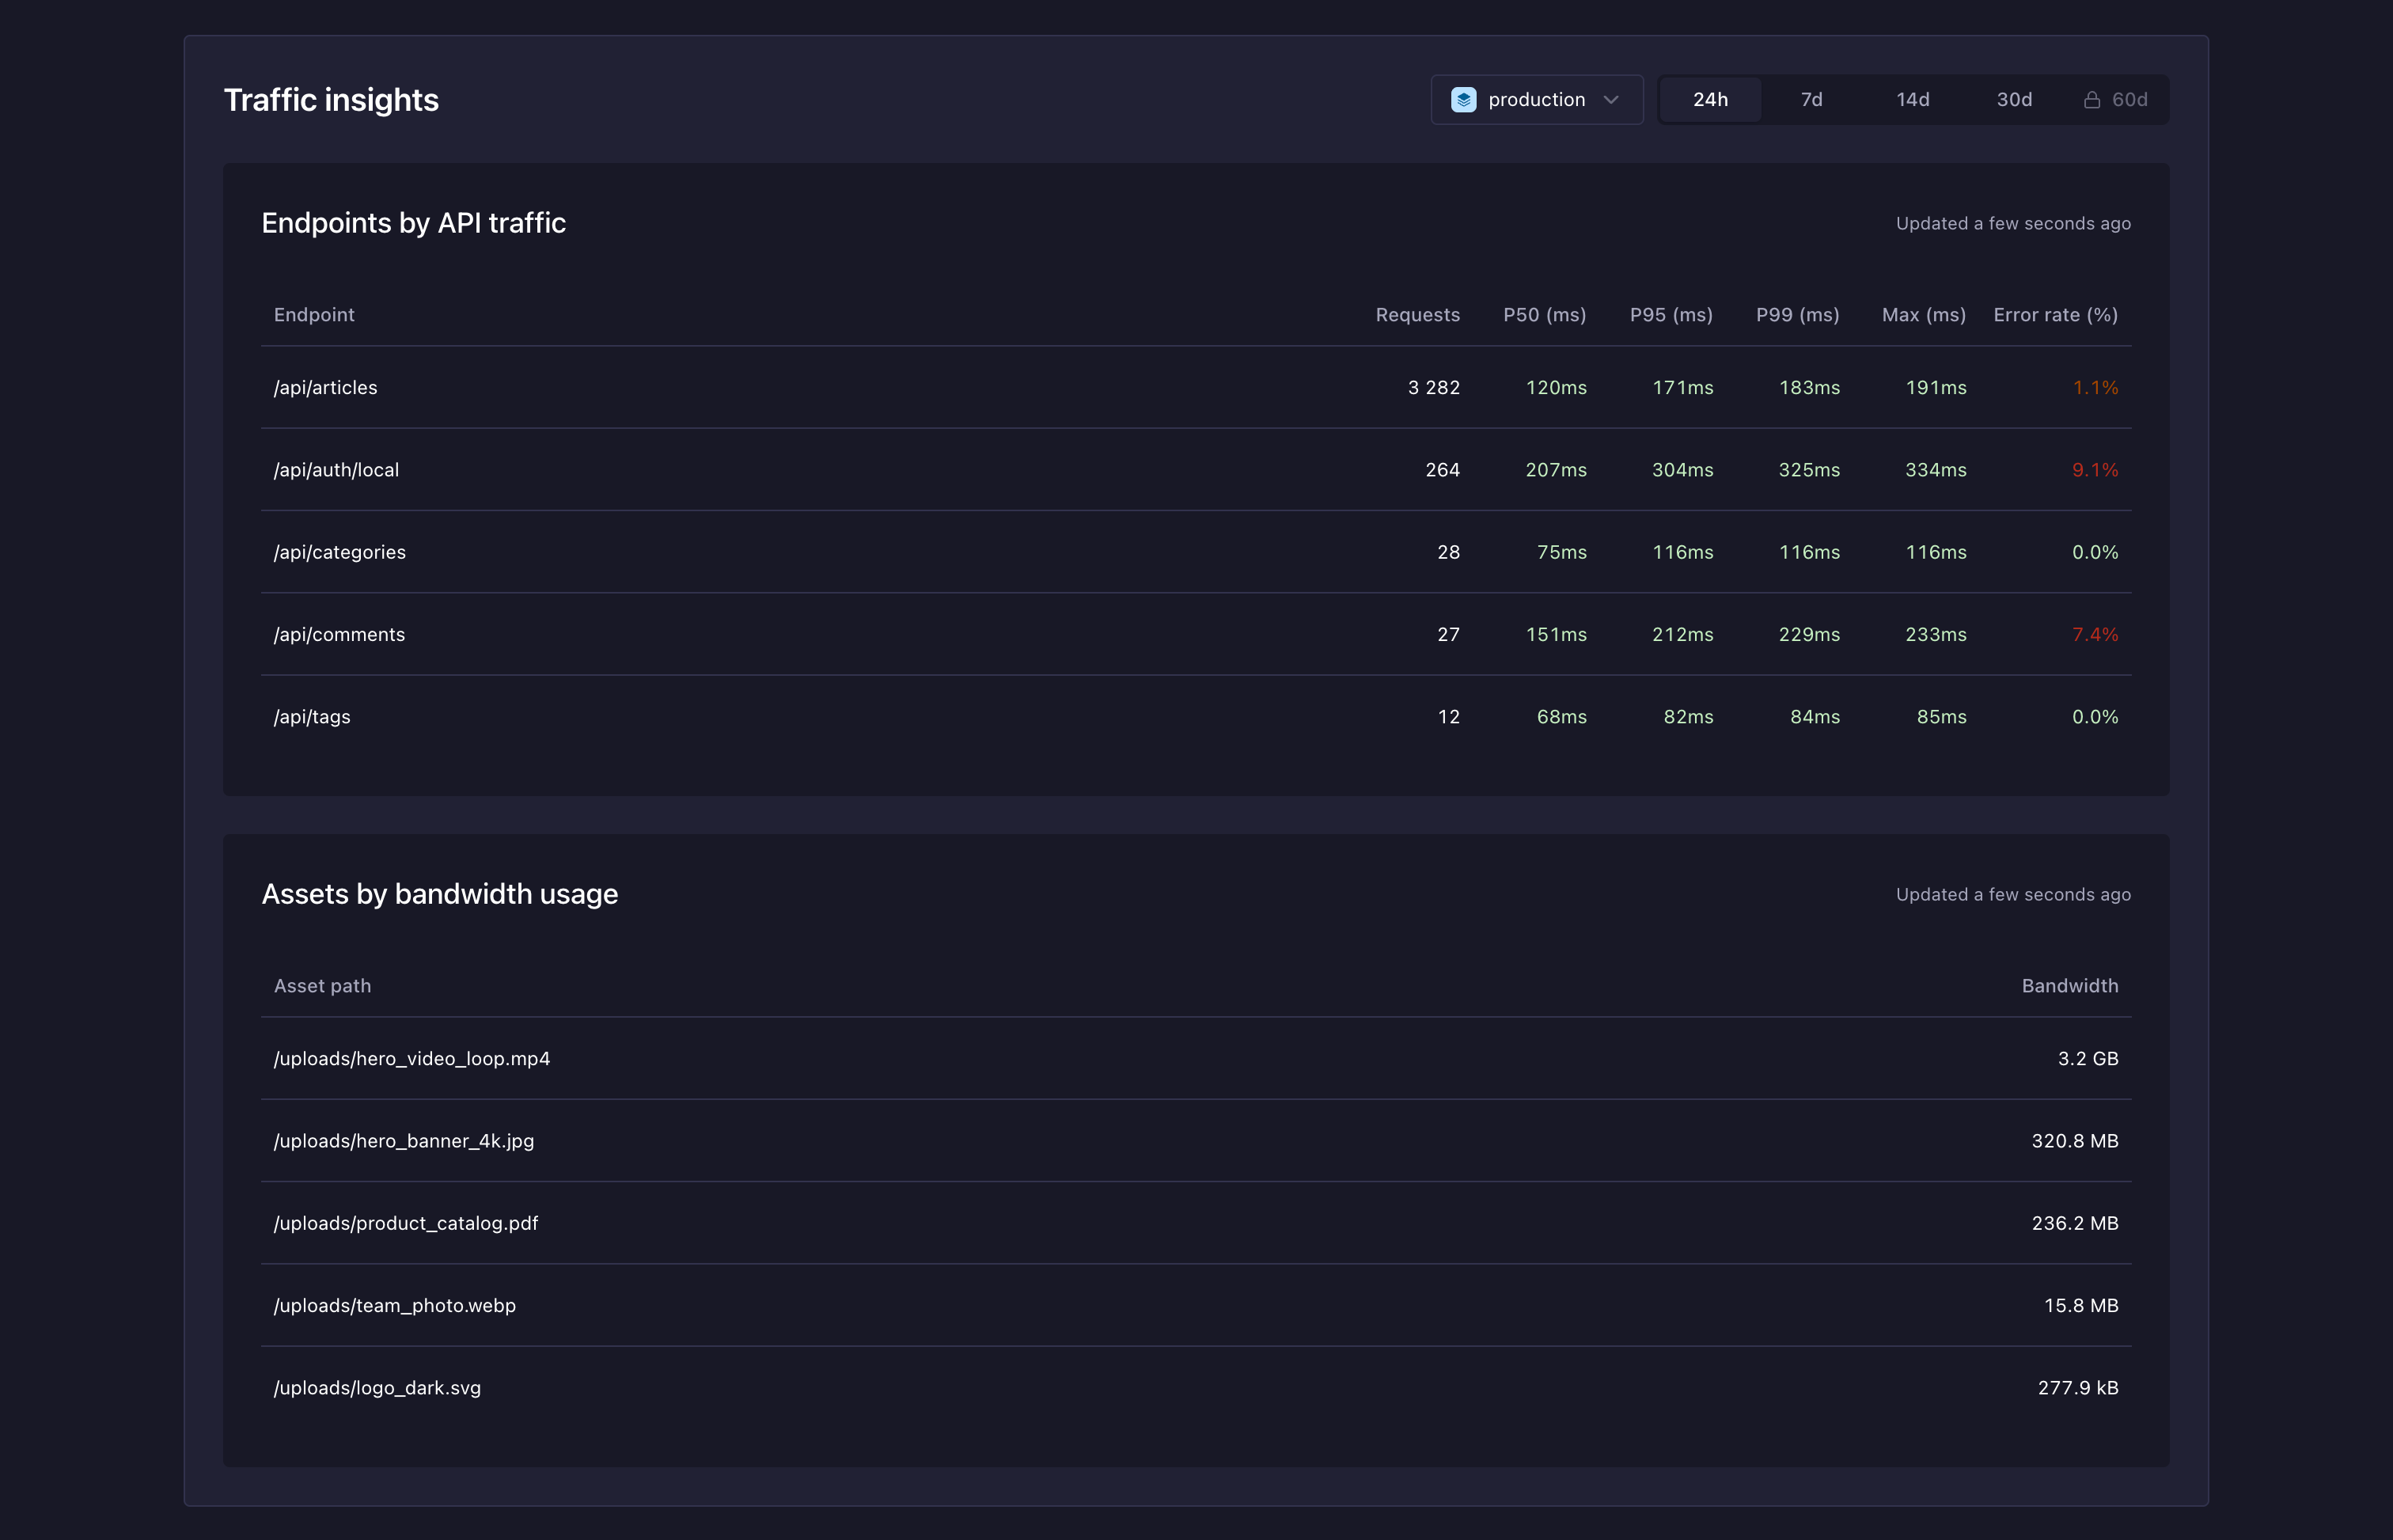
使用环境下拉菜单和时间范围选择器来筛选数据。可用的时间范围与项目消耗中的相同。
🌐 Use the environment dropdown and the time range selector to filter the data. The available time ranges are the same as in Project consumption.
按 API 流量排序的顶层端点
🌐 Top endpoints by API traffic
按 API 流量排序的顶部端点 表列出了在所选期间收到请求最多的 5 个 API 端点,并显示以下指标:
🌐 The Top endpoints by API traffic table lists the 5 API endpoints that received the most requests in the selected period and displays the following metrics:
| 列 | 描述 |
|---|---|
| 端点 | 匹配的 API 路径。 |
| 请求数 | 选定期间的请求总数。 |
| P50 (毫秒) | 中位响应时间。50%的请求完成速度比此值快。 |
| P95 (毫秒) | 第95百分位响应时间。95%的请求完成速度比此值快。 |
| P99 (毫秒) | 第99百分位响应时间。99%的请求完成速度比此值快。 |
| 最大值 (毫秒) | 在选定期间记录的最高单次响应时间。 |
| 错误率 (%) | 返回4xx响应的请求百分比。 |
按带宽使用量排序的顶层资源
🌐 Top assets by bandwidth usage
按带宽使用量排名的顶层资源 表列出了在所选期间消耗带宽最多的5个资源,并显示以下指标:
🌐 The Top assets by bandwidth usage table lists the 5 assets that consumed the most bandwidth in the selected period and displays the following metrics:
| 列 | 描述 |
|---|---|
| 资源路径 | 资源的文件路径。 |
| 总带宽 | 在所选期间此资源传输的总数据量。 |
CPU 和内存使用情况
🌐 CPU and Memory usage
CPU 和内存随时间变化 部分显示你的应用使用的 CPU 和内存占可用资源的百分比。
🌐 The CPU and Memory over time section shows your application's CPU and Memory consumption as a percentage of the available resources.
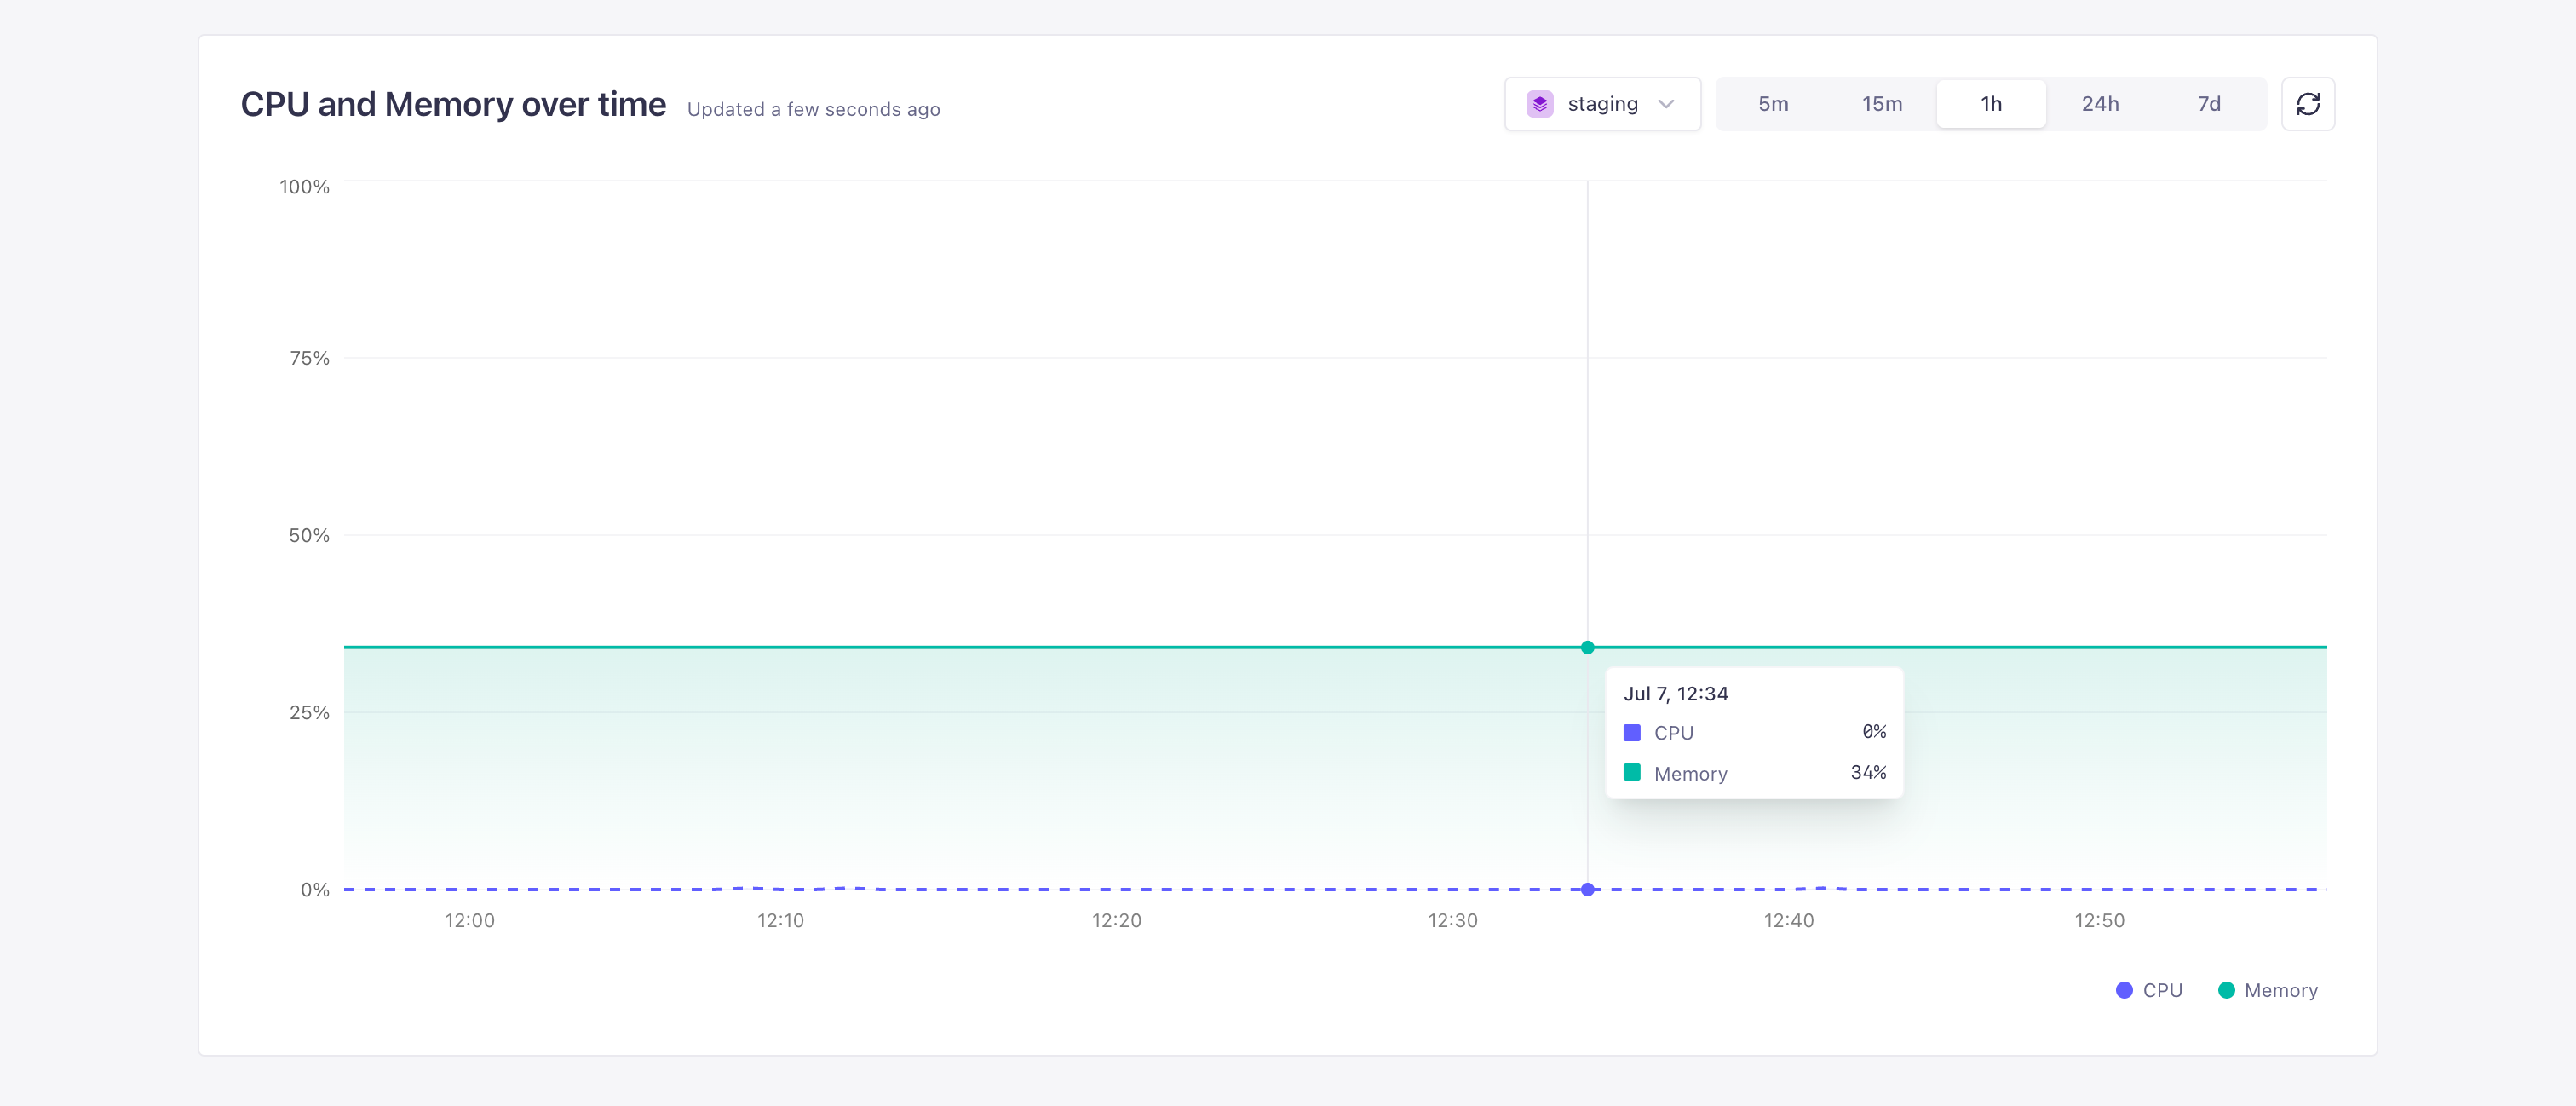
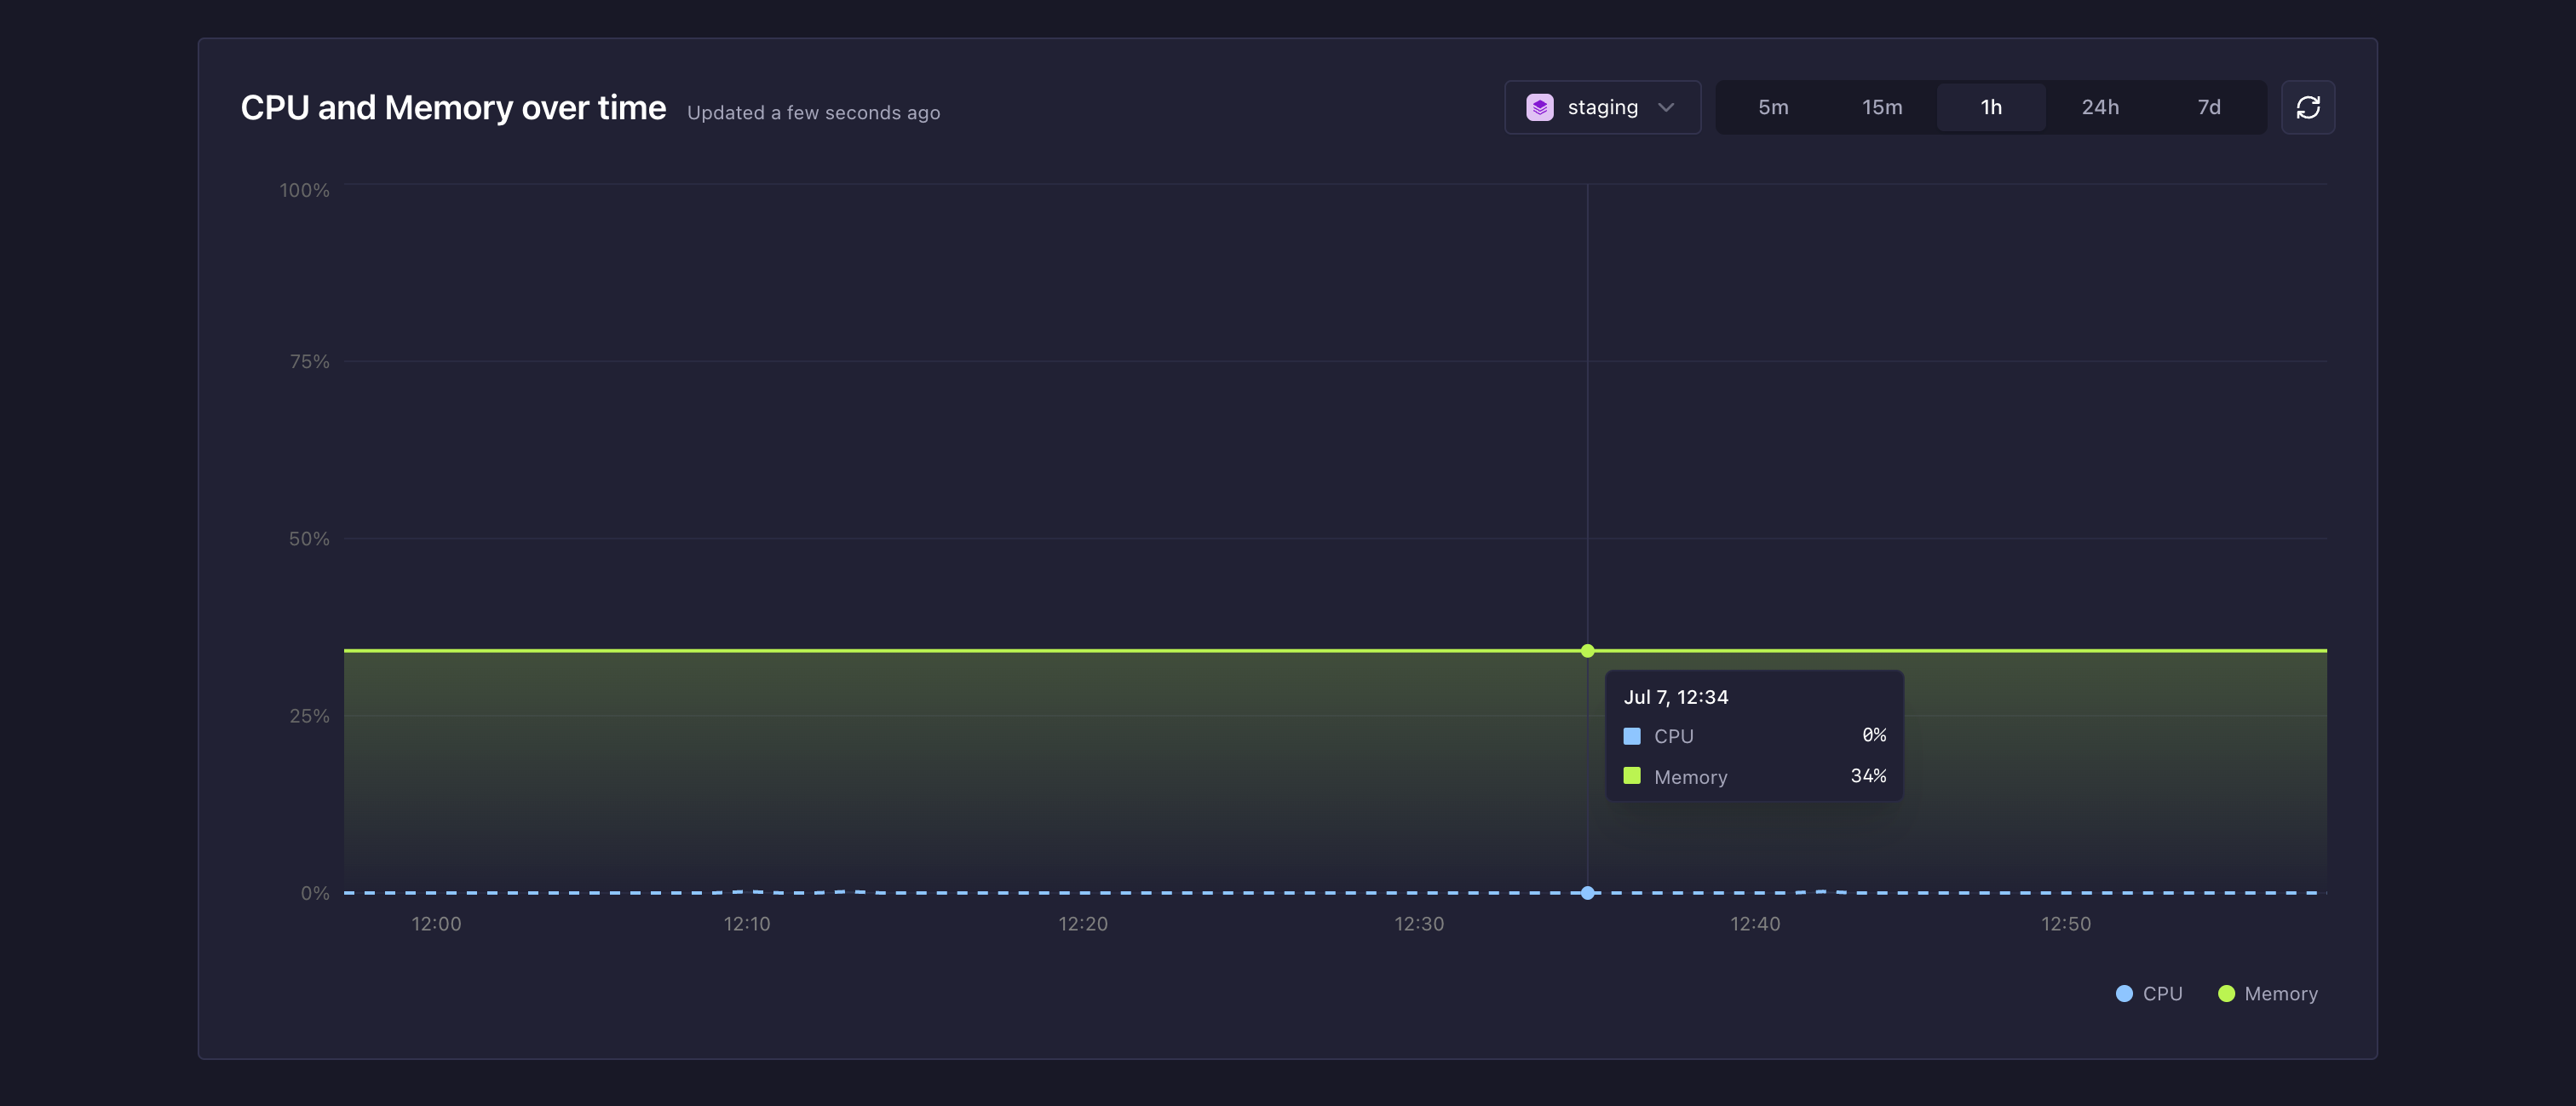
该部分显示一个包含 2 个系列的区域图:
🌐 The section displays a single area chart with 2 series:
- CPU:显示为蓝色虚线
- 内存:显示为绿色实线
使用视图右上角的 环境 下拉菜单选择要显示指标的环境,并使用时间范围选择器调整时间周期。将鼠标悬停在图表上可以看到显示特定时间点 CPU 和内存值的工具提示。数据根据所选范围按小时或按日显示。
🌐 Use the environment dropdown at the top right of the view to select which environment's metrics to display and the time range selector to adjust the period. Hover over the chart to see a tooltip showing the CPU and Memory values at a specific point in time. Data is displayed hourly or daily, depending on the selected range.
点击部分工具栏中的刷新按钮 以手动加载最新数据。该部分也会自动刷新:
- 每30秒一次,适用于5米和15米范围
- 在1小时、24小时和7天范围内每5分钟一次