云项目日志
🌐 Cloud project logs
Page summary:日志标签在一个可搜索、可筛选的表格中显示你项目的实时日志。点击任意条目以查看其完整消息和元数据。
在项目仪表板中,日志 标签会将项目的实时日志以结构化条目的形式流式传输,你可以搜索、过滤和检查这些条目。
🌐 From the project dashboard, the Logs tab streams the live logs of the project as structured entries you can search, filter, and inspect.
日志 页面只有在项目成功部署后才能访问,在重大环境操作期间(如项目创建、数据传输或环境清理)无法访问。
🌐 The Logs page is only accessible once the project has a successful deployment and is inaccessible during major environment operations, such as project creation, data transfer, or environment clearing.
查看日志
🌐 Viewing logs
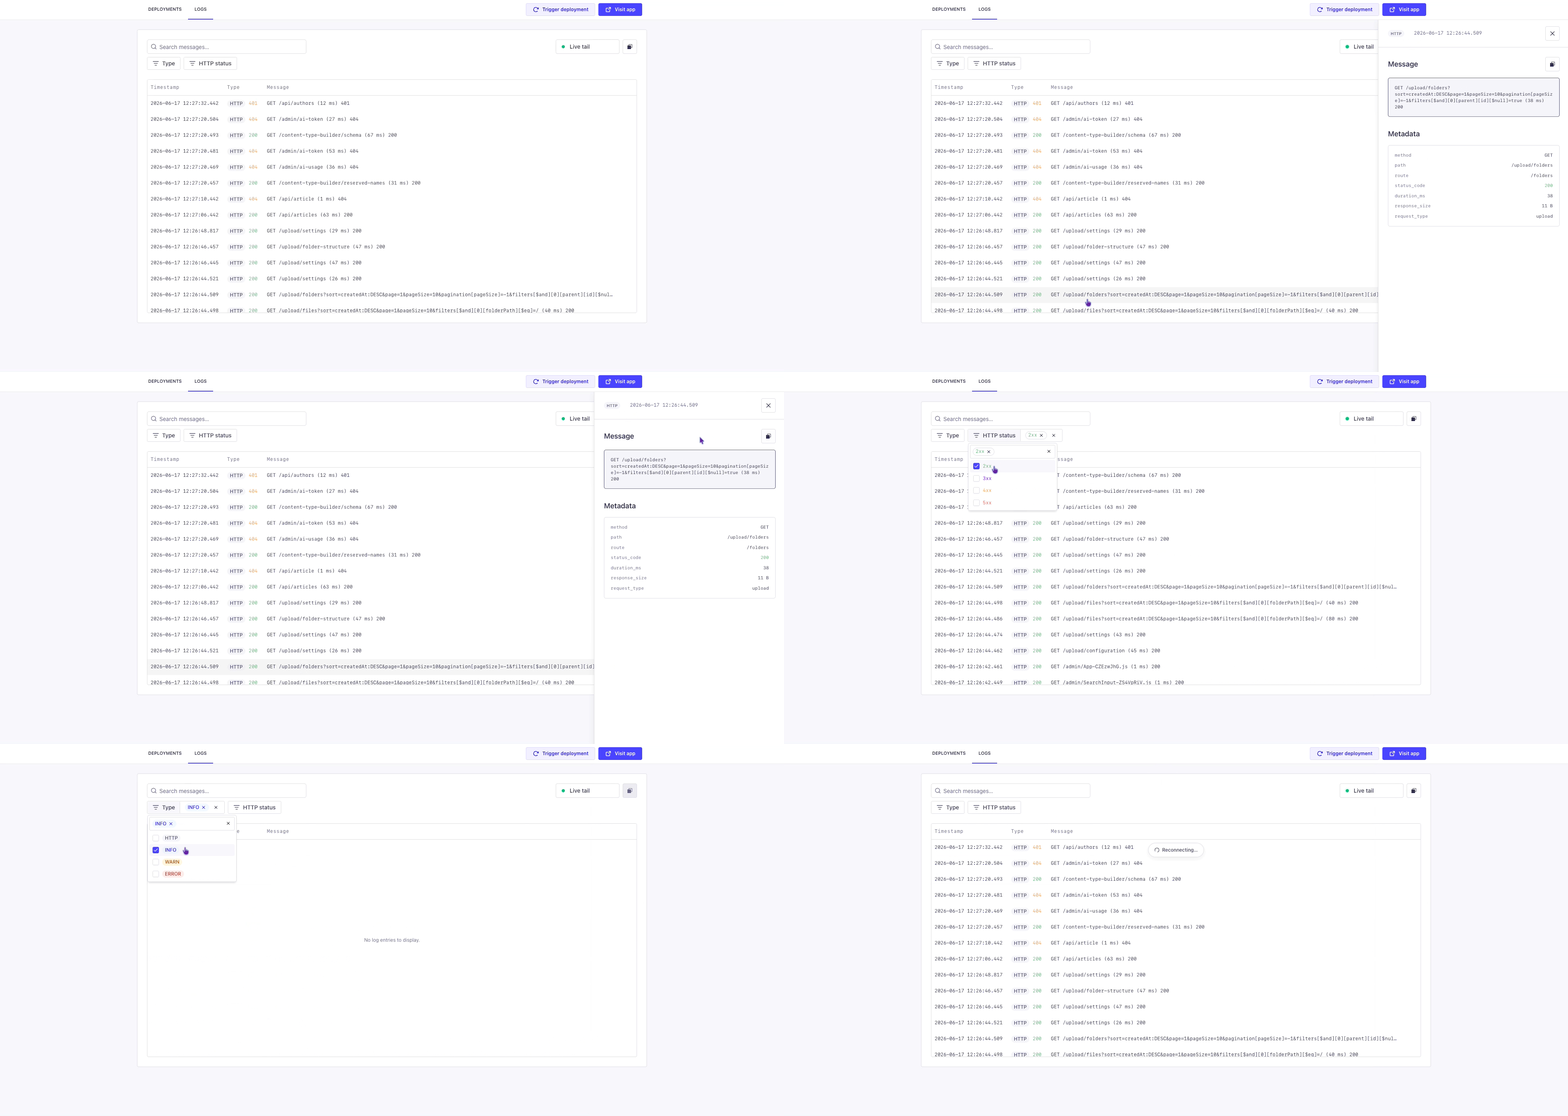
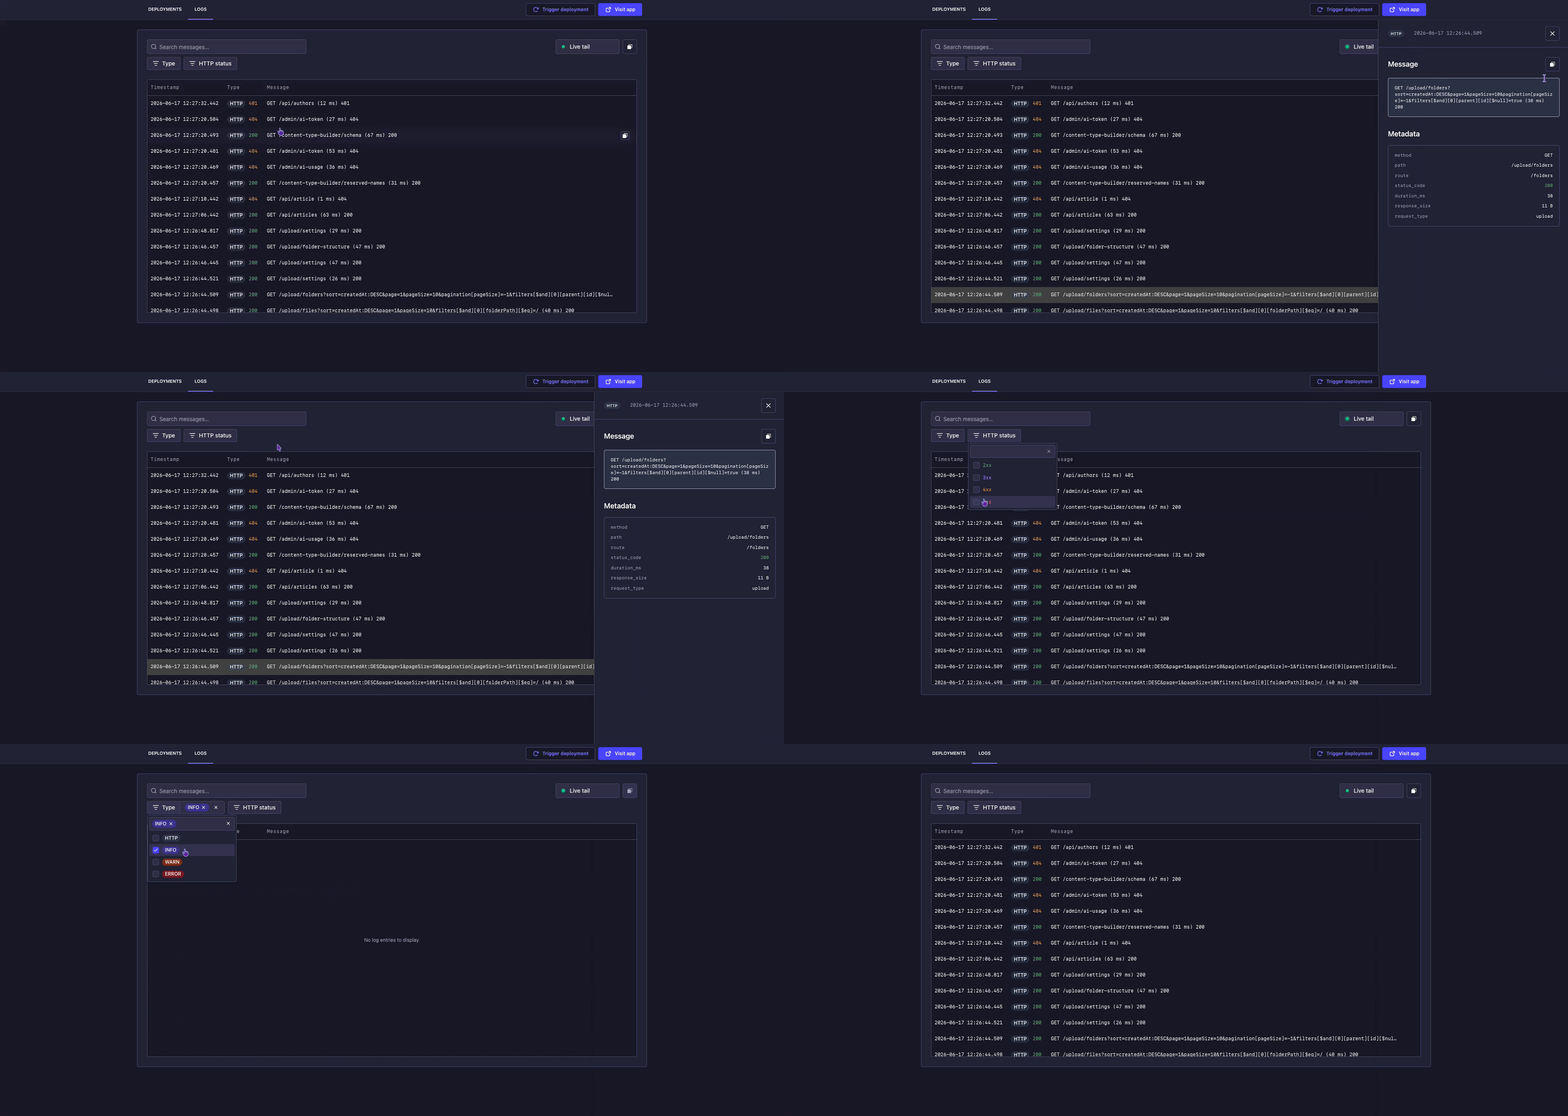
查看器跟随实时日志流并自动滚动以保持最新条目在视图中。每行显示三列:
🌐 The viewer follows the live logs stream and auto-scrolls to keep the latest entries in view. Each row shows three columns:
| 列 | 描述 |
|---|---|
| 时间戳 | 日志发出的时间。 |
| 类型 | 日志级别,错误、警告、信息 或 HTTP,显示为彩色徽章。对于 HTTP 条目,响应状态码显示在徽章旁边。 |
| 消息 | 日志消息。表格中长消息会被截断;点击条目可在抽屉中查看完整文本。 |
你可以通过点击在行悬停时显示的复制按钮 ,或在抽屉内的按钮来复制单条日志记录。要复制当前日志查看器中显示的所有条目,请使用工具栏中的复制按钮 。
实时日志流当前仅限于最近15分钟,并且最多为100,000行。历史日志可见性正在开发中。
🌐 The live log stream is currently limited to the last 15 minutes and capped at 100,000 rows. Historical log visibility is under development.
检查日志条目
🌐 Inspecting a log entry
点击任意日志行以打开详细信息抽屉并显示完整消息,并在可用时显示日志的元数据。元数据部分显示以下信息:
🌐 Click any log row to open a detail drawer and display the full message and, when available, the Metadata of the log. The Metadata section shows the following information:
| 字段 | 描述 |
|---|---|
method | HTTP 方法(例如 GET、POST)。 |
path | 请求的路径。 |
route | 匹配的应用路由。 |
status_code | HTTP 响应状态码。 |
error_type | 错误分类,当条目为错误时。 |
duration_ms | 处理请求所用的时间,单位为毫秒。 |
response_size | 响应的大小。 |
request_type | 请求类型(例如 API、管理员)。 |
查看历史日志
🌐 Viewing historical logs
使用工具栏中的时间范围选择器在实时模式和有限的历史范围之间切换。查看器默认显示最近15分钟。
🌐 Use the timeframe selector in the toolbar to switch between live mode and a bounded historical range. The viewer defaults to the last 15 minutes.
可用时间范围取决于你的 Strapi Cloud 计划:
🌐 Available time ranges depend on your Strapi Cloud plan:
对于所有非实时的时间范围,选择器旁会出现一个刷新按钮,用于手动重新加载范围。在实时模式下,日志会自动刷新。
🌐 For all non-live timeframes, a Refresh button appears next to the picker to manually reload the range. In live mode, logs refresh happens automatically.
搜索和筛选日志
🌐 Searching and filtering logs
你可以使用搜索和筛选工具来优化查看器中显示的日志。筛选器和搜索可以结合使用,例如,你可以仅显示提到特定路由且状态为 5xx 的 HTTP 条目。
🌐 You can use the search and filter tools to refine the logs displayed in the viewer. Filters and search combine, so you can, for example, show only HTTP entries with a 5xx status that mention a specific route.
在引入结构化查看器之前部署的项目,其日志以纯文本显示,不支持搜索、过滤或每条日志的元数据。要访问新的日志查看器,请触发项目的手动重新部署。
🌐 Projects deployed before the structured viewer was introduced display their logs as plain text, without search, filtering, or per-entry metadata. To access the new log viewer, trigger a manual redeployment of the project.
搜索栏
🌐 Search bar
在搜索字段中输入,以仅保留消息中包含你文本的条目。
🌐 Type in the search field to keep only the entries whose message contains your text.
类型筛选
🌐 Type filter
按以下日志级别筛选:
🌐 Filter by the following log levels:
- 错误
- 警告
- 信息
- HTTP
错误日志以红色标出,以便在浏览时高亮。
🌐 Error logs are highlighted in red so they stand out as you scan.
HTTP状态码过滤器
🌐 HTTP status code filter
按以下状态码筛选:
🌐 Filter by the following status codes:
- 2xx
- 3xx
- 4xx
- 5xx